
Book roundup, January 2020
Somehow I am very fond of those non-technical statistic / probability books, longing to learn more in this area but subconsciously surrendering to my technical incompetence. Luckily, there are many pageturners carefully crafted by wonderful authors, and I was able to finish a few of them during the holiday.
The Art of Statistics: Learning from Data
by David Spiegelhalter
I first learn about this book from a random post in Nature, and placed the preorder right away. Spiegelhalter champions the “PPDAC” structure(Problem-Plan-Data-Analysis-Conclusion) heavily, and sprinkles with ample of real-world examples, such as the historical fatality rate of British children, to illustrate his points. Aside from demonstrating basic statistical concepts, sometimes with counter-examples, one aspect that might be left out from other similar books, but Spiegelhalter spends two whole chapters discussing (How Things Go Wrong, and How Can We Do Statistics Better), is how to properly communicate the analysis results. In the present world that is filled with click-bait articles (more chocolate consumption leads to more Nobel prizes), this book not only allows readers a more powerful filter, but also provides the statistic practitioners a check-list on how to most effectively get the message delivered to the intended audience.
Strangely, even I finished this book a couple of months ago, there are two examples that have stuck in my mind since. One is the relationship between fathers’ height and the of their sons. Looking at the scatter plot, one can not resist the temptation to build a simple linear regression model to make some prediction, for example, the son’s height from the father’s height. However, as the predictive model would imply the causality, we would know that the slope of the simple linear regression has to be one, in which case makes the model totally pointless. Therefore, common senses triumph any statistical model.
The other example is about Simpson’s paradox. The Wikipedia page provides a very good example already, but the one shown in the book is even more striking. It is about admission rates at Cambridge University by different genders, only in this case, for every department, women have a higher admission rate, yet as a whole, the men have a higher admission rate. Can it be more paradoxical than that?
| Women | Men | |||||
|---|---|---|---|---|---|---|
| Applied | Accepted | % | Applied | Accepted | % | |
| Computer Science | 26 | 7 | 27% | 228 | 58 | 25% |
| Economics | 240 | 63 | 26% | 512 | 112 | 22% |
| Engineering | 164 | 52 | 32% | 972 | 252 | 26% |
| Medicine | 416 | 99 | 24% | 578 | 140 | 24% |
| Veterinary Medicine | 338 | 53 | 16% | 180 | 22 | 12% |
| Total | 1,184 | 274 | 23% | 2,470 | 584 | 24% |
The Drunkard’s Walk: How Randomness Rules Our Lives
by Leonard Mlodinow
I borrow this book from the New York Public Library, and it was directly delivered to my Kindle (thanks to the wonderful Libby). I wished I’ve known this earlier :(. Not only it is free, there is also a deadline for me to finish it. That ties very well with an old Chinese saying: books are not borrowed won’t be read (书非借而不能读也).
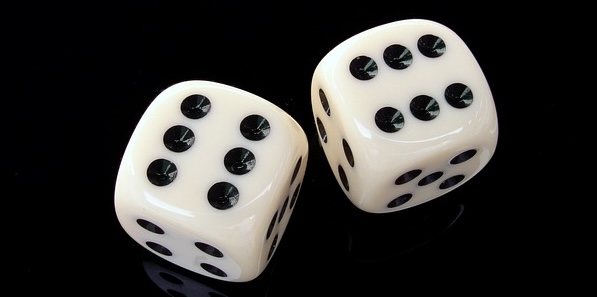
This book is more about probability, and how to always take randomness into consideration, whether be it the star Wall Street trader, or the successful career of Bruce Willis. It traces the chronological development of the field of probability, through the contributions from luminaries such as Gerolamo Cardano, Blaise Pascal, Jacob Bernoulli, Pierre-Simon Laplace, and Ronald Fisher, and always ask the readers the question of: can the observed results are due to pure chance? We humans are very good at identifying patterns from observations, so good that we are willing to mistake noise for signal, and this happens a lot, as
even random patterns can be interpreted as compelling evidence if they relate to our preconceived notions.
One could argue that, there are tools for us to combat such illusion, e.g., under the Frequentist paradigm, using p-value to control the type-I error. However, remember that, when the null hypothesis is true (the results are indeed due to randomness), one can still observe the statistically significant outcome, with the probability of \(\alpha\), where \(\alpha\) is the pre-determined type-I error rate. The below simulation (code here) nicely demonstrates this fact.
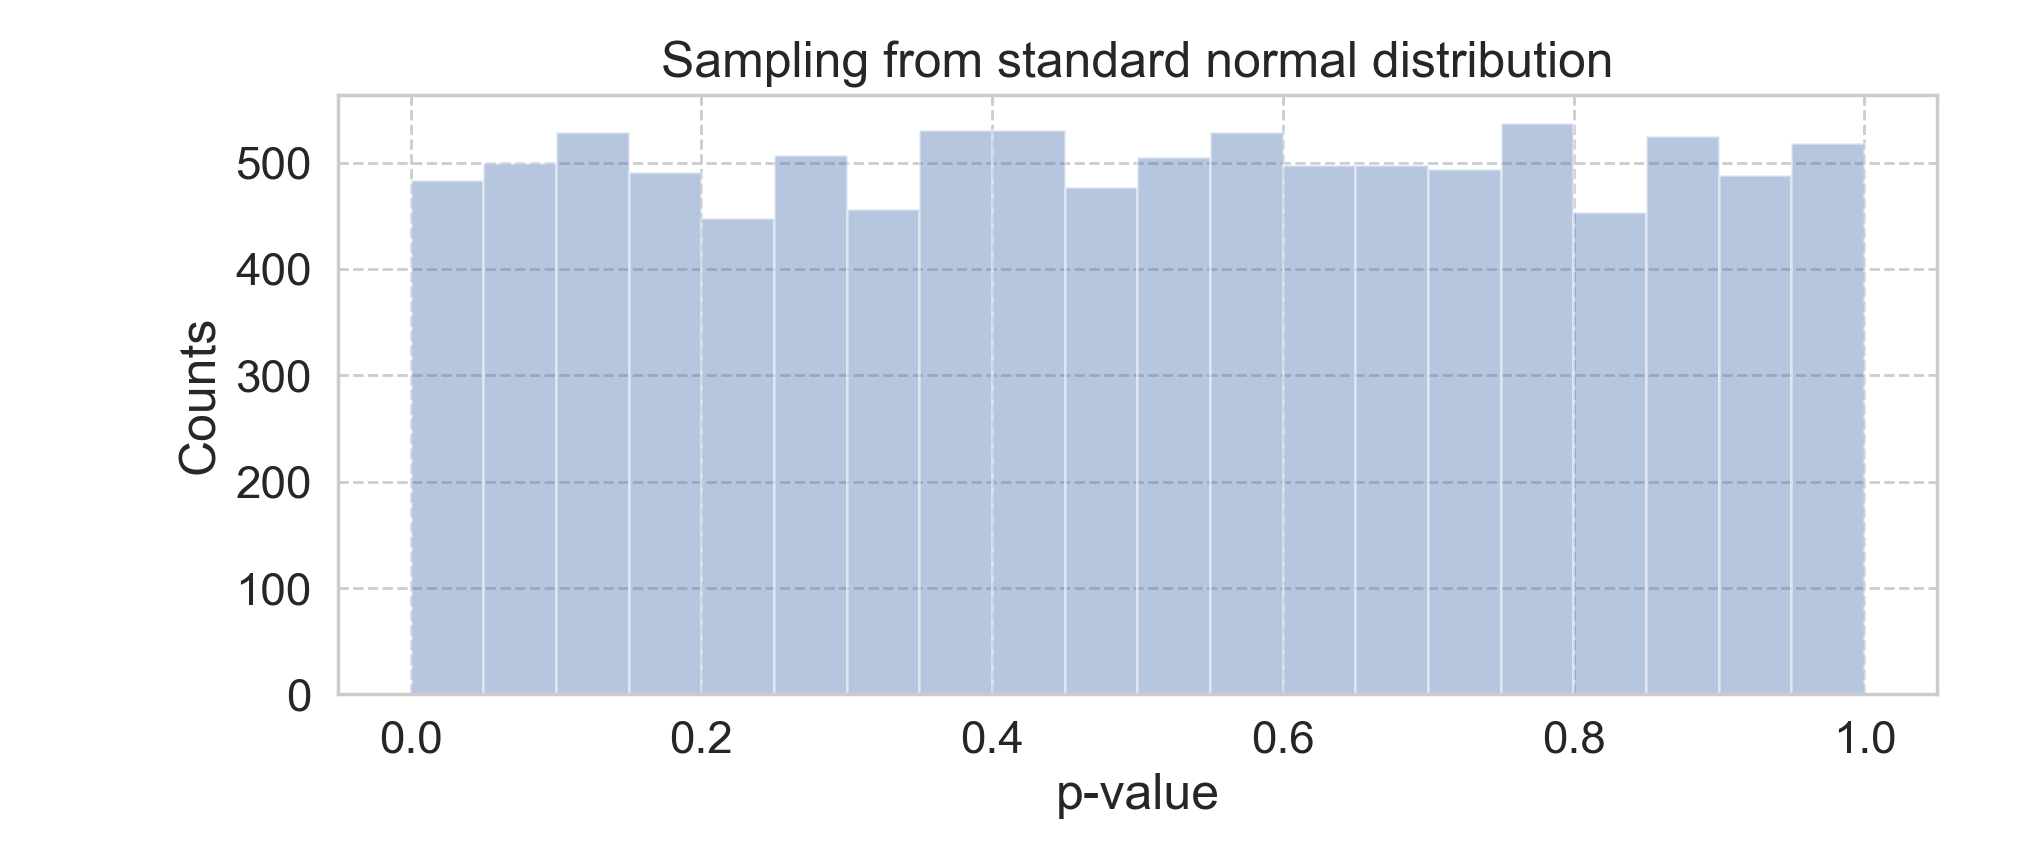
That said, even geared with scientific tools, one still needs to be mindful of how randomness can manifest itself into our lives.
Mostly Harmless Econometrics & Counterfactuals and Causal Inference: Methods And Principles For Social Research
These two books are more on the technical side, i.e., having equations, and I yet to go through either of them. I started with the MHE, but somewhat got stuck in Chapter 3. Then I was introduced to CCI, and with the background learned, it is rather straightforward making progress. Moreover, CCI also touches upon the causal graph, which by itself can be a rabbit hole for me to fall into. I also found this Coursera course quite useful too.
The biggest theme in both books (and in causal inference) is (linear) regression. Both books go rather deep in the rationals behind the choice of linear regression (that hurts my brain). In the current age with the most complex models are just a few import away, it is even more important to learn these basics.
I’ll keep working on them.
Leave a Comment