
How to use US Census Bureau data
Recently I had to learn the US Census Bureau data, to explore the demographic information at the ZIP code level. In the past, I usually Google search for nicely parsed data, e.g., total population at each ZIP code, and chances are there are someone already made the data available. After all:
- The data is free (from the US Census Bureau).
- The size of the data is (usually) small enough to be downloaded (after all there are about 400,000 ZIP codes across US).
However this time around, I am interested in more than the common demographic information, therefore, I reckon it is better to query directly from the data source, and I did learn quite a few things about the US Census data.
US Census Bureau does not know ZIP code
The commonly known concept of ZIP code is defined by US Postal Service (USPS), in order to facilitate efficient mail delivery. However, the US Census Bureau operates and organizes data under its own geography entity hierarchy, and it does not honor the USPS ZIP code. As shown below, the smallest geographic entity is a Census Block (think it as a city block), and rolling all the way up to the Nation level. As such, US Census Bureau data can not directly answer the question such as “what is the population of ZIP code 10027”.
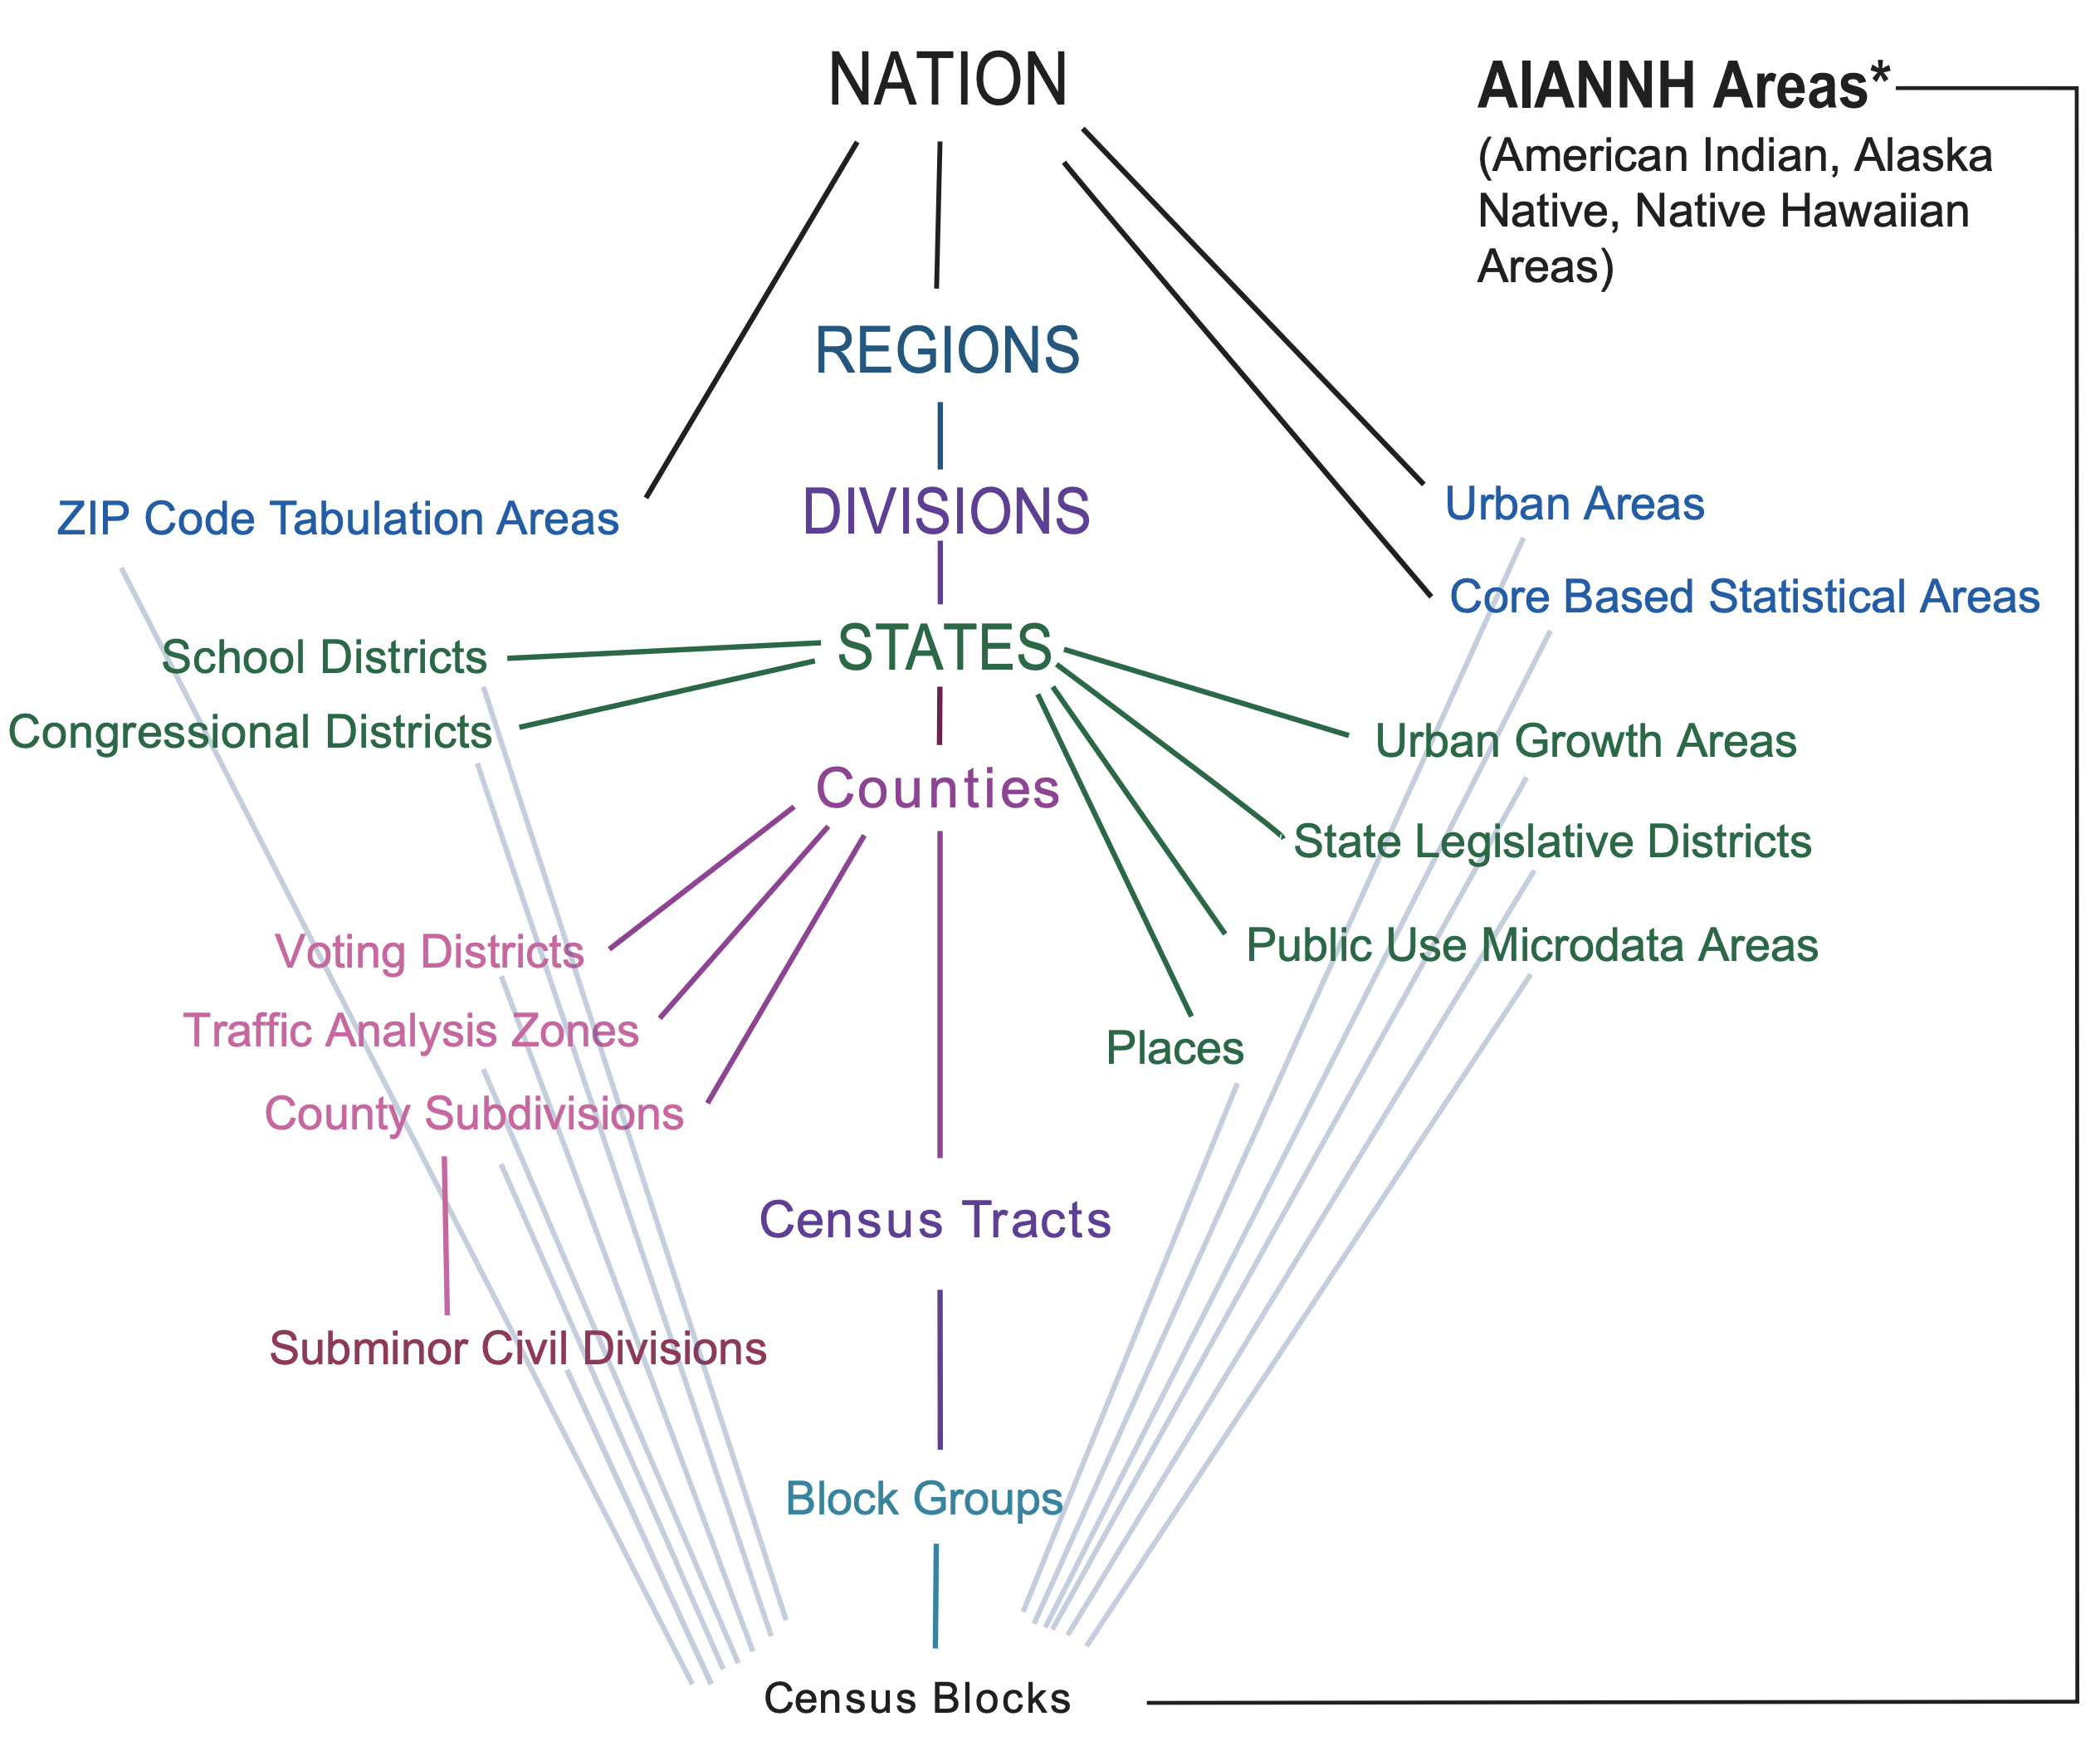
To map the US Census Bureau data at the ZIP code level, the closest geographic entity is the Census Tract (there are about 70,000). However, it is a many-to-many mapping, i.e., a Census Tract can contain multiple ZIP codes, and a ZIP code can cover multiple Census Tracts as well. I found some convenient crosswalk files that provide such mappings.
But there is an easier way. Since 2000, the US Census Bureau introduced the geographic entity of ZIP Code Tabulation Areas (ZCTAs). Per Wikipedia:
This new entity was developed to overcome the difficulties in precisely defining the land area covered by each ZIP code.
The documentation from US Census Bureau provides the details of how ZCTAs are created. Probably the important aspect to a data consumer is:
In most instances the ZCTA code is the same as the ZIP Code for an area.
Good enough for me! It would be nice to quantify most, but I will give the benefit of the doubt and operate under the
mode of ZIP code == ZCTA.
Use ACS, not the Census itself
The colloquial of “US Census” usually refers to the decennial census, that conducted once every 10 years (the most recent one is in 2020). It is a complete count of the entire U.S. population, and asks just a few questions about every person and household. The public artifact of the Census is the Public Law (P.L.) 94-171 Redistricting Data. From the name, it is not hard to guess the purpose of the data: to re-draw the US congressional districts and reapportioning the House of Representatives. Therefore, we can consider it only provides the population count, and nothing more.
The treasure trove of the US Census Bureau data, is the American Community Survey (ACS). It conducts continuously since the early 2000s, and is an ongoing survey of just a portion of the population. The ACS asks dozens of questions on a wide variety of topics to gather information about the demographic, social, economic, and housing characteristics of the population. The main differences between the decennial census and ACS are:
- The decennial census, well, is a census. It is an one-time, complete count of the population.
- The ACS is an ongoing survey, designed to provide up-to-date information about communities throughout the United States, enabling policymakers, businesses, and individuals to make informed decisions.
As a data consumer, I’m almost always interested in ACS, given the rich information it provides. However, being a survey, we need to keep in mind we are dealing with point estimates. Fortunately, for each of the information (e.g., family income), US Census Bureau also provides the margin of error. Another factor to consider is how many samples are used to derive the point estimate. In ACS case, this is conveyed through how many years of survey results are used. Currently there are only two options: 1-year estimate and 5-year estimate. The tradeoff is pretty intuitive: the former reflects more recent trends, whereas the latter provides smaller margin of errors.
Accessing the ACS data
To be honest, it is not very intuitive how to access the US Bureau data, at least for someone who is new to it. After a few days’ digging, hopefully the following steps would save you some time. Here I assume we are interested in the bulk download, not API calls (which is available).
Search for the table of your interest
US Census Bureau provides a handy entrypoint to search for all available tables. Apply the appropriate filters (from the left panel), for example, with the 2021 ACS 5-year estimate data. This will result in more than 1000 tables. We can then further filter by the topics, for example, education. In this case, there are less than 100 tables left.
Each of the table comes with an alphanumerical table identifier (e.g., “B06009”), and a long description (e.g., “PLACE OF BIRTH BY EDUCATIONAL ATTAINMENT IN THE UNITED STATES”). The default view will be at the national level, and one can apply “Geography” filter to obtain aggregation at different geographic entities (e.g., ZCTA). Since our goal is to make bulk downloads, knowing the table identifier is enough. With the table identifier in hand, we can leverage the FTP service provided by the US Census Bureau, to directly download the raw files.
Data dictionary
The raw data will be in tabular format, and a piece of key information is the data dictionary, i.e., what each column means. To understand it, one should probably (highly recommended) first read the ACS manual.
For the 2021 ACS 5-year estimate, this is the data dictionary, i.e., mapping between the table identifier, the name of each column in the tables, and the semantics. For example, the first few lines read:
Table ID|Line|Indent|Unique ID|Label|Title|Universe|Type
B01001|1.0|0|B01001_001|Total:|SEX BY AGE|Total population|int
B01001|2.0|1|B01001_002|Male:|SEX BY AGE|Total population|int
...
It indicates for the table with id of “b01001”, the columns with names of “B01001_E002” and “B01001_M002” means the Estimate and Margin of error for “total population of male”, respectively. Note that the injected letter E and M in the column names.
Download the table from FTP
All the tables are accessible, even from your browser. A better way to access the data is to
download them programmatically. This
is a simple Python snippet I coded up, to download a single table, and filter at the given geographic entity level.
Here I use the ZCTA (summary_level=860) as an example.
Note that, for the ACS 5-year estimate, each table contains aggregation at all geographic entity levels (aka, summary level).
The geographic entity is identified by the column GEO_ID, while there doesn’t seem to have an
official definition of the GEO_ID, this is a very good resource to use.
Conclusion
Here we describe how to understand and access US Census Bureau data. Hopefully it can save you some time Googling around for nicely parsed US demographic related information, as you can easily download them from the source!


Leave a Comment